
RingoJS vs. Node.js: Runtime Values
As the main developer of a server-side JavaScript platform in 2010, it’s quite impossible to ignore Node.js. Node is hot, and deservedly so. It’s a fast and well-crafted piece of software built on the simple concept of single-threaded, event based I/O. And it uses Google’s V8 JavaScript engine, a true marvel of virtual machine design. Node has a fast growing, vibrant community of developers. It’s great to see server-side JavaScript blossom!
But, as I’ve said before (and would have loved to say at JSConf.eu this weekend, had they accepted my talk), Node is not the right tool for everybody and everything. The asynchronous coding style it enforces puts a huge burden on developers by breaking up program flow into many small pieces. Early Node adopters don’t seem to mind, but maybe that’s just because early adopters tend to be a skilled and adventurous bunch.
Node’s gospel is that asynchronous evented I/O is the only way to write scalable network servers. In my eyes, this is pretty much an unproven assertion. It may be true for simple, I/O based servers, especially those that use long-running connections. But even then, is it really necessary to put oneself inside an async jail? In my opinion, supporting synchronous and asynchronous request handling equally well should be a cornerstone of any forward thinking web platform. (For the record, we also added streaming async responses and WebSockets to Ringo’s arsenal since I wrote that article.)
So the point of this benchmark is to show that performance is not as simple as it may seem. Alex Payne (of Twitter fame) has written a great article about Node and scaling. He argues that there are different kinds of scaling - scaling in the small, and scaling in the large - and that Node does not magically solve all of these problems.
Maybe then, like with scaling, there may be different kinds of performance as well. Granted, Node has plenty of raw execution speed. Rhino, the JavaScript engine we’re using, is worlds slower than V8, and the only way we can keep up (and the benchmark shows we can) is by writing performance critical code in Java (or Scala, or any other ‘fast’ JVM language). It helps that interoperability between JS and Java is dead simple and there’s tons of useful Java libraries out there, but yes, Rhino’s relative slowness is one of our sore points.
So what does this benchmark measure? I think it’s mostly about how well the embedding code (Node and Ringo) blends with the underlying virtual machine (V8 and JVM, respectively) to create an efficient server-side runtime. Virtual machines are tuned for particular scenarios. The JVM’s strength has been on the server side for many years, while V8’s home is definitely the client. We’ll see how that turns out in numbers.
Results
(For more information on the code I ran and how I ran it please refer to the Fine Print section below.)
The first part of the benchmark is pretty straightforward.
It’s a hello-world HTTP benchmark, but with a slightly larger (1 kB) response.
Node outperforms Ringo quite clearly in this benchmark, serving 7335 requests
per second compared to Ringo’s 4271. Enabling HTTP keepalive would have
boosted Ringo’s performance to be on par with Node, but the way keepalive is
implemented in Apache Bench does not fare well with Node so I disabled it.
This benchmark is our reference point for the other benchmarks, which are based
on it.
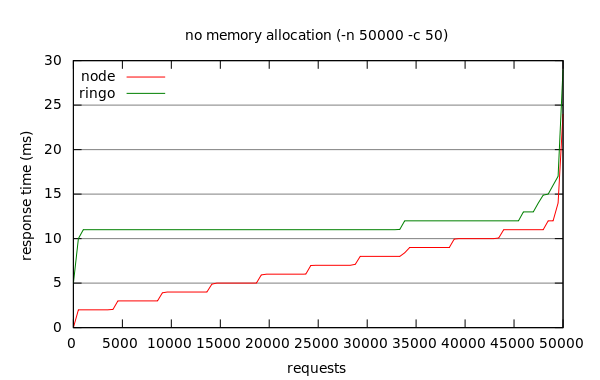
The graph above shows the distribution of response times across all 50,000 requests made. Note how response times are spread across the range for Node, while they are almost constant for Ringo. This is a result of Node’s single-threaded versus Ringo’s multi-threaded request handling, and it will become even more noticable in the following benchmarks.
My next move was to do some amount of object allocation. Object allocation and collection is a bottleneck in many high-traffic web applications. Evan Weaver reported a year ago that Twitter spends as much as 20% of front-end CPU time on garbage collection, with a staggering 67,500 objects allocated per website request.
The easiest way to allocate memory is to create binary buffers, so I changed the
hello-world benchmark to allocate 50 kB of buffers per request.
The results are quite remarkable. Ringo’s performance is barely impacted by
the additional memory allocation and collection cost, going down to 3831
requests per second. Node performance, however, is more than halved and drops
down to 3196 requests per second.
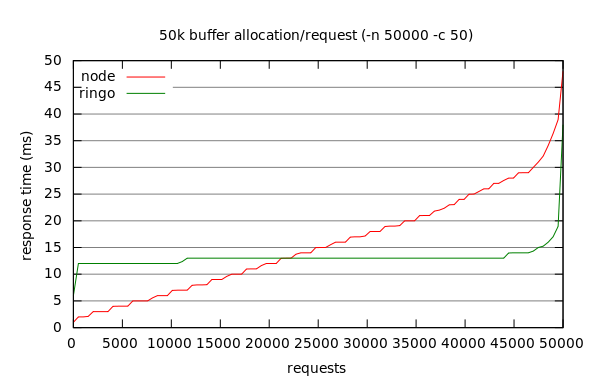
Note that the benchmark is run over 50,000 requests to make sure that garbage collection takes place. Over the run, 2.5 GB worth of buffers are allocated. Ringo used approximately 260 MB of RAM for this test, while Node didn’t claim more than 21.
Since Node creates binary buffers outside the V8 heap, I thought that maybe
this is causing higher allocation and deallocation cost (Ringo in contrast
uses ordinary, heap-based byte arrays). Thus I created a new benchmark which
allocates native strings instead of buffers by repeatedly converting
a single buffer to a string. The result was even worse for Node,
which now made 2096 requests per second. In comparison, Ringo still managed
to make 3175.
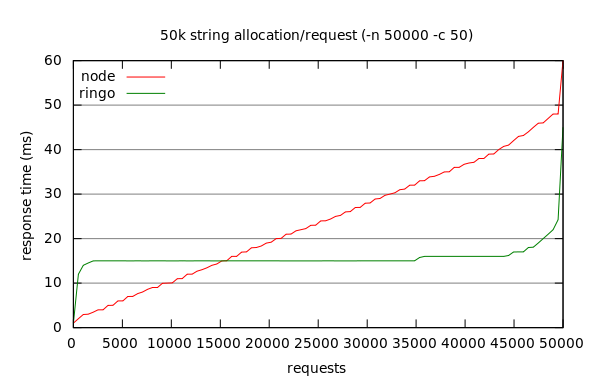
The difference in distribution of response times is most evident in this last benchmark. I think another area that would be interesting to explore is how response behaviour affects latency under load.
What It Means
You should never make important decisions based on benchmarks, especially not those you haven’t written and run yourself. Still, I think if there’s something to take away from this benchmark, it’s that performance is not a black and white thing.
There are two explanations I can think of for the big impact buffer and string allocation has on Node. One is that V8’s memory management and garbage collection just is not built for the turnover rate tested in this benchmark. The other is that Node may have made design decision that optimize for specific things like direct kernel access to buffers, causing trade-offs in other areas. It’s quite possible that it’s a combination of things. Maybe someone who knows Node’s internals better than I do will chime in and provide some clue.
The JVM, on the other hand, proves to be solid platform for server applications with high memory turnover. Many people sneer at the JVM for its large memory footprint, and they have a point. But sometimes, on the server, using the memory that’s available (and using it well) can be a virtue.
Similarly, Rhino has not the best reputation among the JavaScript crowd. It’s true that modern browser JS engines have left Rhino behind, and that’s no miracle if you look at the efforts going into them. But an equal part of Rhino’s bad rap is due to carelessly coded embeddings and running with optimization disabled. Most people are surprised by Ringo’s speed when they try it. You might be, too!
The Fine Print
The code for the benchmark is available on github. There’s also a tarball with the raw results. I ran the benchmark on my ThinkPad T61 running 32-bit Ubuntu 10.4 on a 2.4 GHz Core2 Duo processor. For Ringo, I used the server HotSpot VM which (I think) is the default on Linux. If you are using another VM, your results will likely differ. The usual disclaimers apply.
I tried to make Node use more memory using the --max_old_space_size and
--max_new_space_size options. It increased Node’s memory usage slightly,
but didn’t have any noticable impact on performance.
The versions of Ringo and Node I used were current git snapshots: 9922e4e433996722a76e for Node and e9d3b922f878dcf08b5d for Ringo.